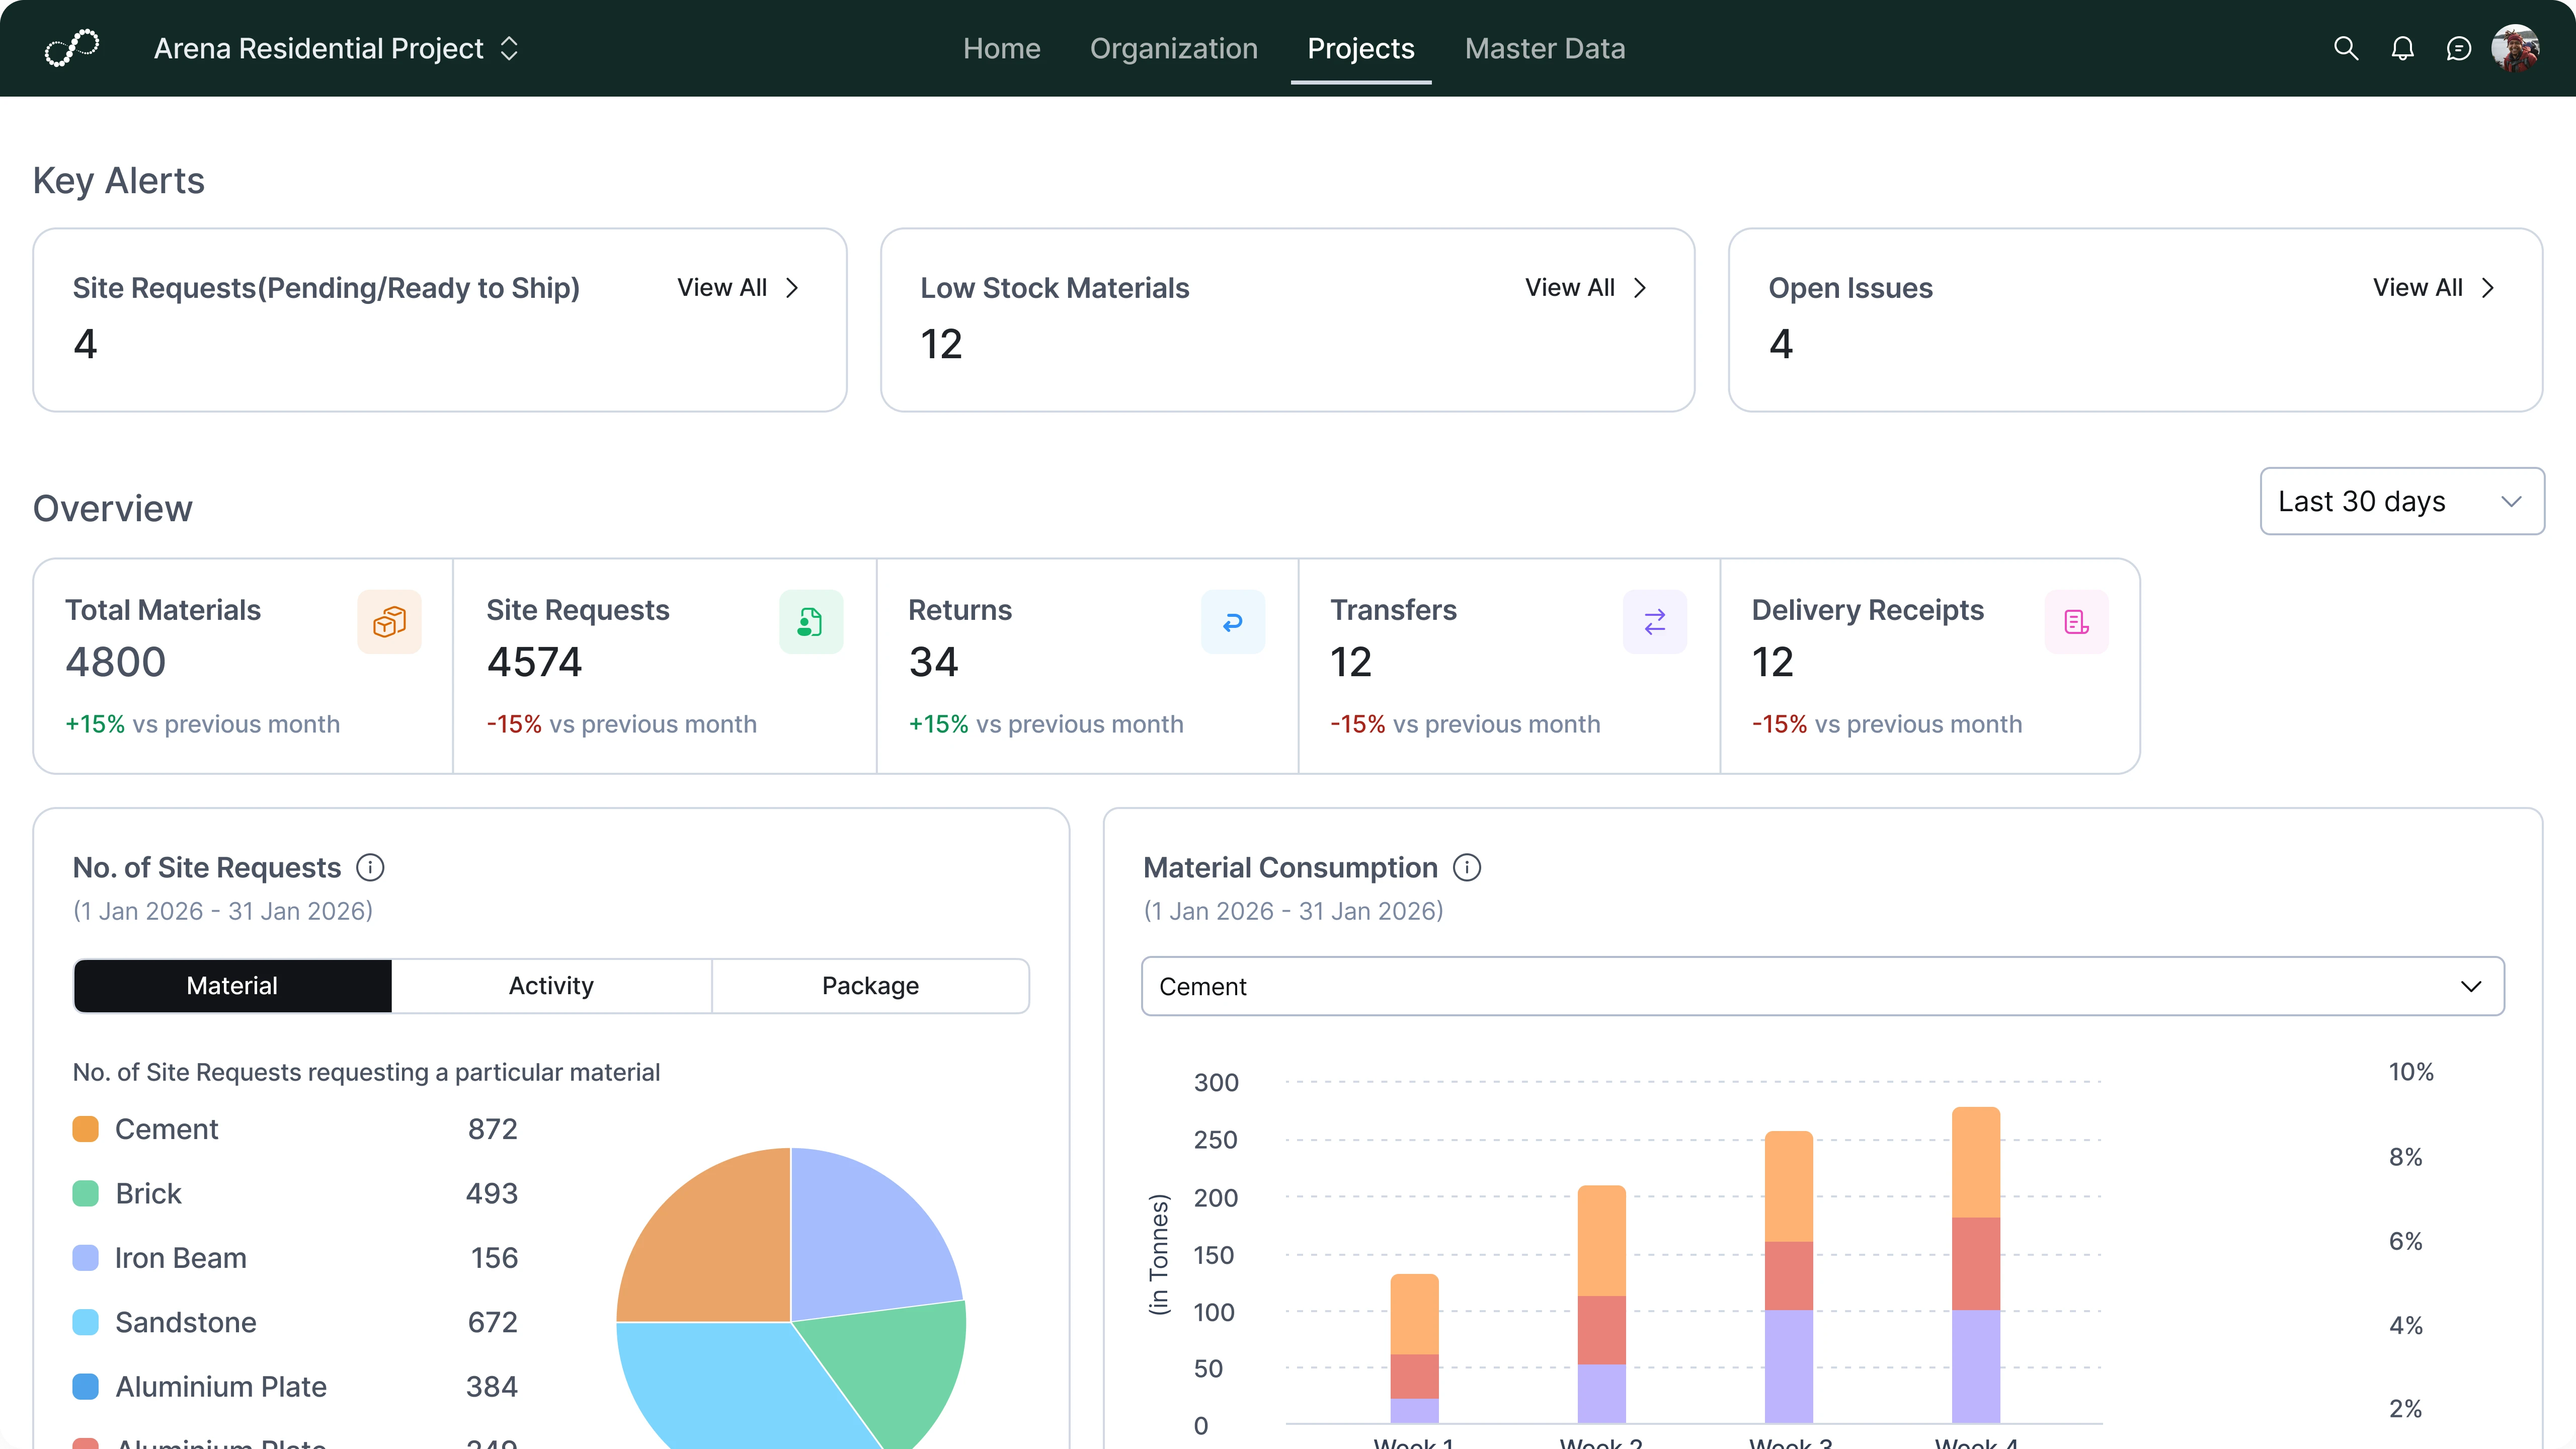
Reporting and Dashboards
Generate structured reports and dashboards from consolidated project data.
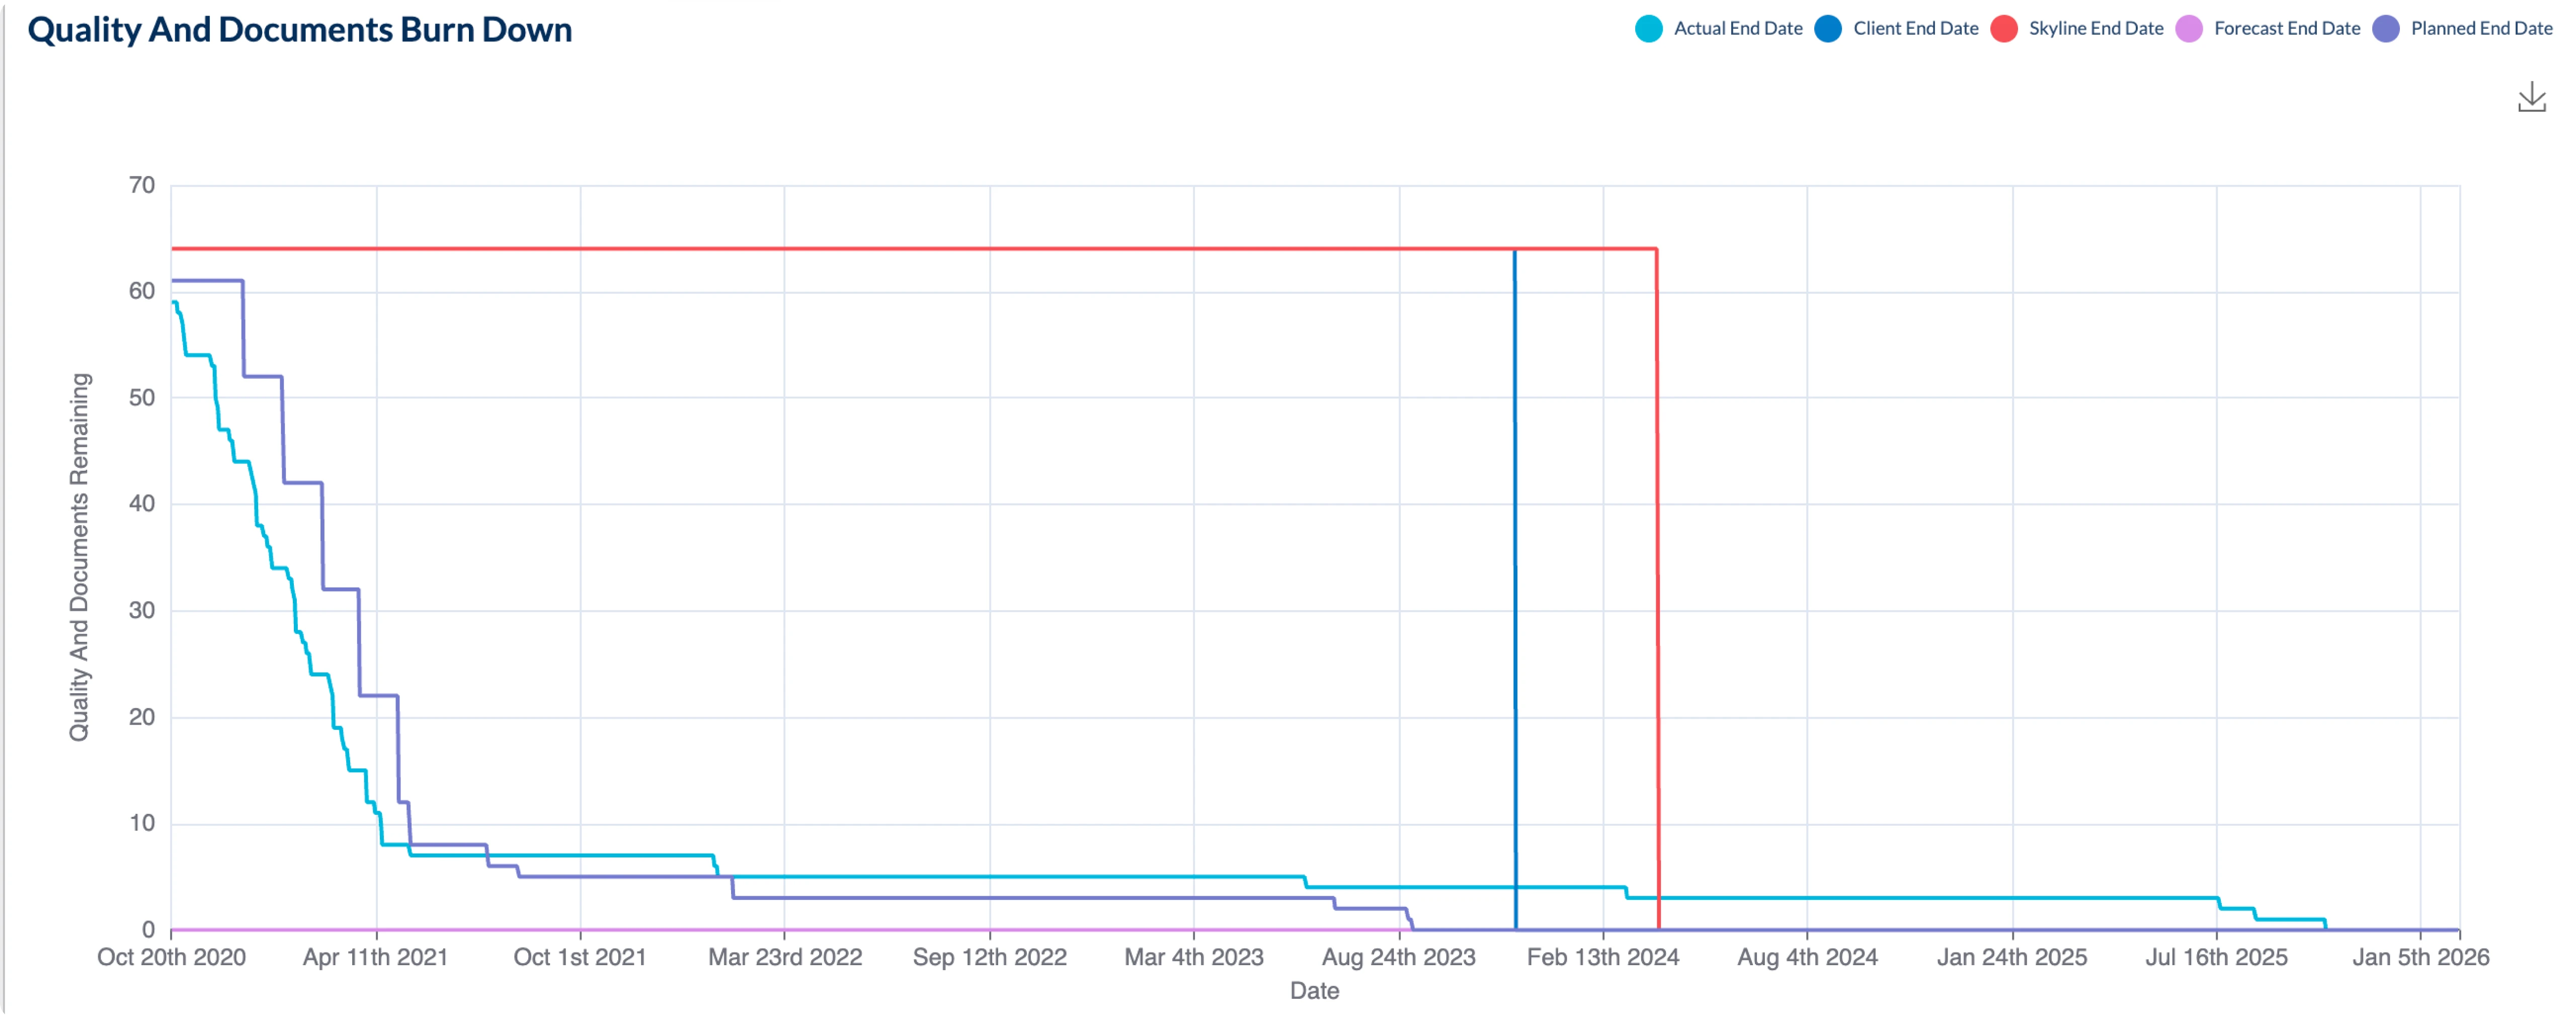
Create standard project reports
Generate reports for progress, cost, quality, and execution data. This provides consistent visibility into project performance.
Build interactive dashboards
Visualize key metrics through charts and tables. Teams can quickly understand project status and trends.
Filter and segment project data
View reports by project, phase, date range, or category. This supports focused analysis and review.
Export and share reports
Download and distribute reports in supported formats. This enables collaboration and external communication.

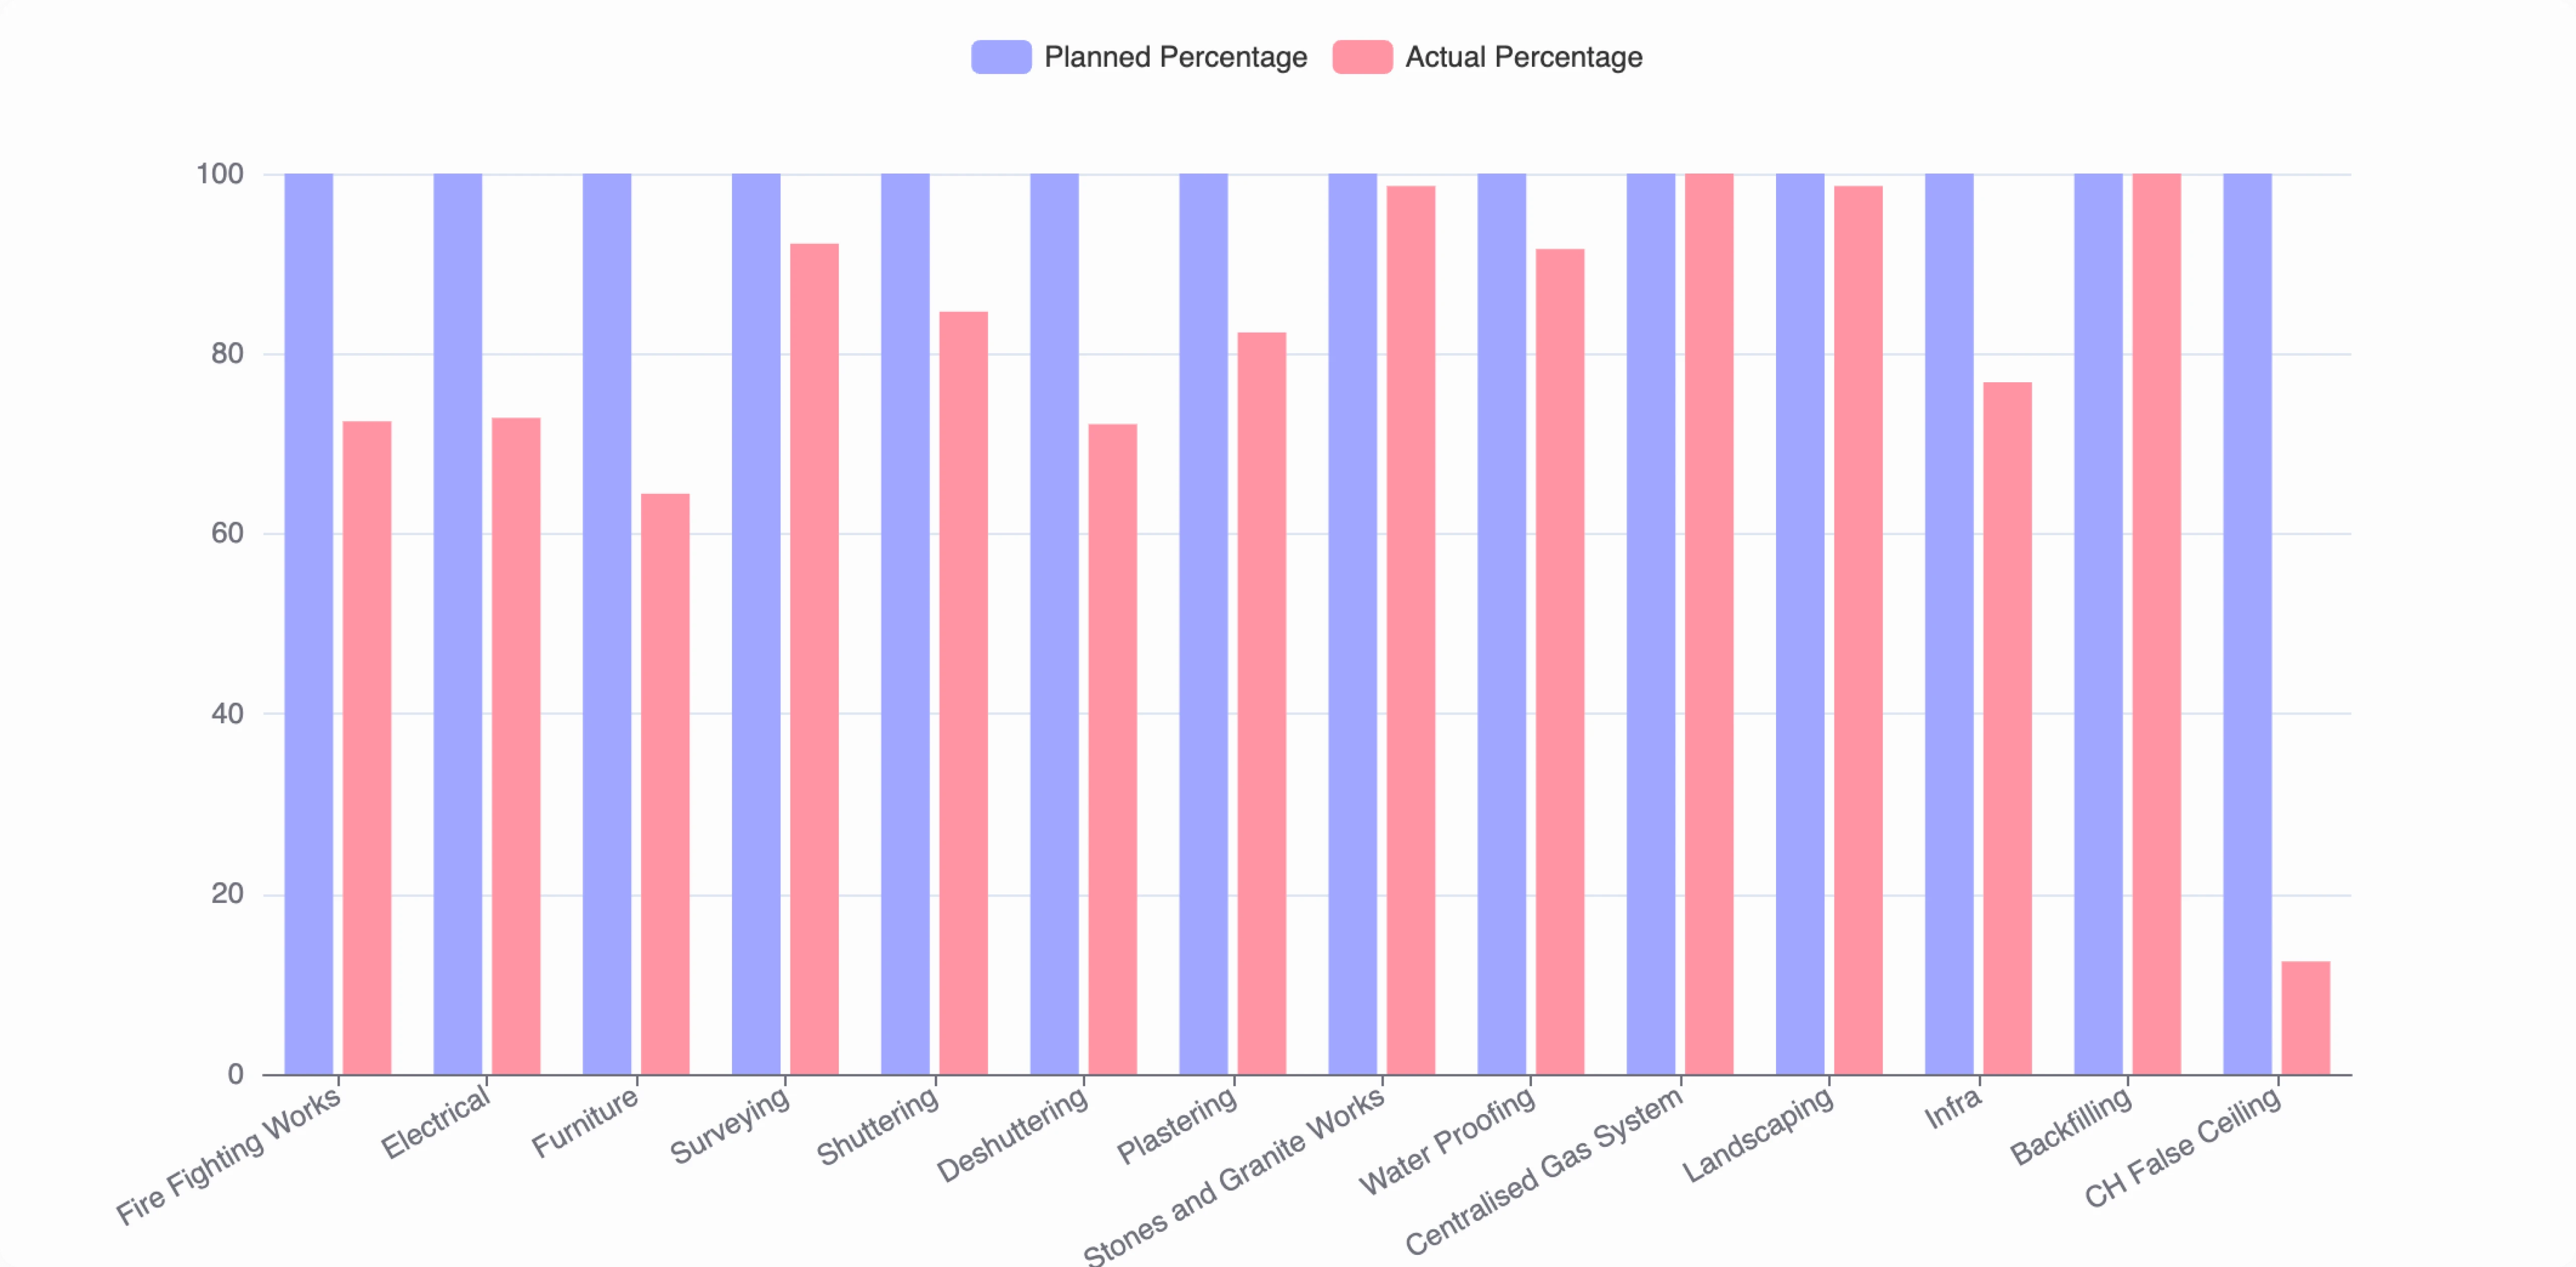
Planned vs Actual Analysis
Compare planned data with actual execution to measure performance.
Track planned versus actual progress
Compare scheduled timelines with site execution updates. This highlights delays and deviations.
Analyze cost against work completed
Link cost data with actual progress achieved. Teams can evaluate spending efficiency.
Identify schedule and cost variances
Automatically surface differences between planned and actual values. This supports early corrective action.
Support trend and performance analysis
Review changes over time to understand project direction. This helps forecast future outcomes.
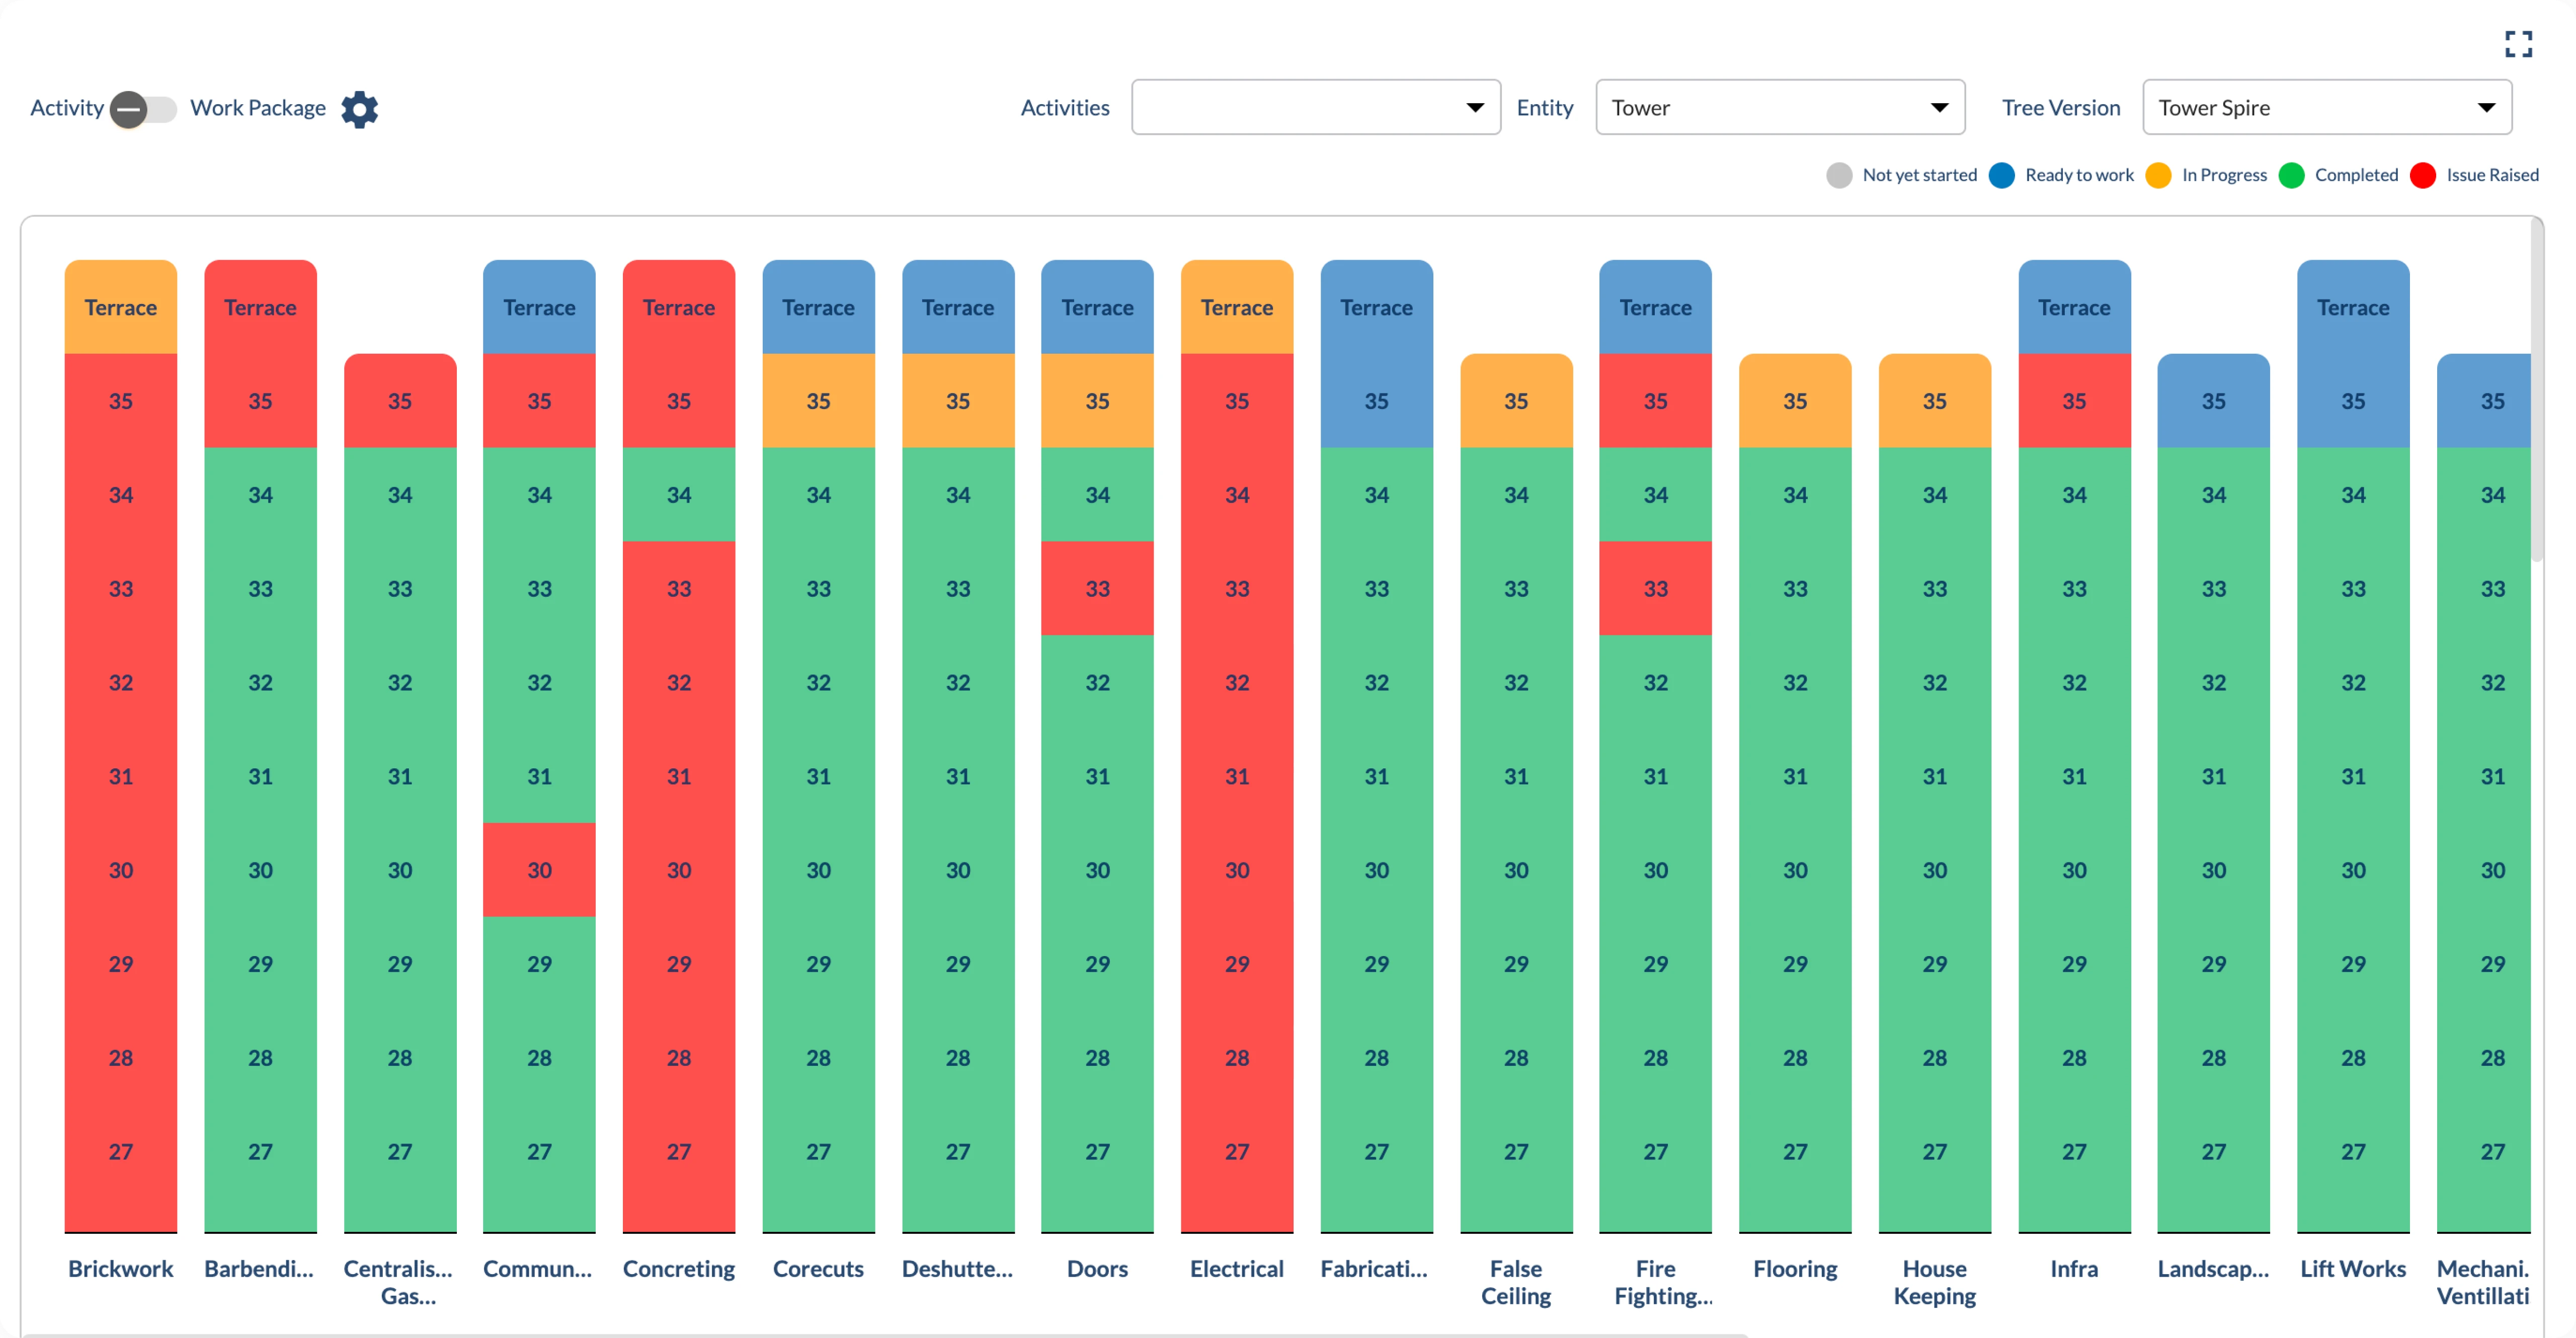
Cross-Module Data Consolidation
Bring together data from multiple project modules into a unified analytics layer.
Consolidate data from planning and field systems
Use WBS, schedules, and site updates as inputs for analytics. This ensures reports reflect real execution.
Integrate cost, quality, and safety data
Combine information from different functional modules. This provides a holistic project view.
Use standardized master data for reporting
Apply common data definitions across reports and dashboards. This ensures consistency and accuracy.
Maintain a single source of truth
Store analytics-ready data in a centralized system. This avoids duplication and mismatched numbers.
Enterprise and Portfolio Analytics
Enable organization-level visibility across multiple projects.
View performance across projects and regions
Analyze data at portfolio and enterprise levels. Leadership gains broad operational visibility.
Track key KPIs and metrics
Monitor standardized indicators such as progress, cost variance, and risk trends. This supports strategic oversight.
Compare projects using common benchmarks
Evaluate performance using the same reporting structure. This highlights best practices and problem areas.
Support data-driven management reviews
Provide leadership with reliable dashboards for review meetings. Decisions are based on measurable information.